NAACCReview

Cancer Surveillance and the 2020 Economy: Thinking about Industrial/Occupational (I/O) Data in Current Context

Robert H. McLaughlin

Interim Senior Director of Operations

Theresa Alfaro-Velcamp

Program Manager, User Experience Research

Cancer Registry of Greater California (CRGC)


Full Article

July 31, 2020


TITLE

Cancer Surveillance and the 2020 Economy: Thinking about Industrial/Occupational (I/O) Data in the COVID-19 Pandemic


INTRODUCTION

The ongoing COVID-19 pandemic elevates the importance of understanding occupation and employment data in relation to public health. Cancer registries and surveillance programs are now challenged to evaluate the effects of the global COVID-19 pandemic on cancer incidence, including 22 million job losses in April 2020 (See Table 1). Surveillance programs will seek to describe how the abrupt cessation of economic activities has changed routine environmental exposure risks for immunocompromised patients and survivors, especially those who may be or have recently been working in retirement or participating in the “gig” economy. Attention to industrial and occupational (I/O) data may enhance the long-term capacity for research and understanding of the cancer burden. As epidemiologists have shown in Japan, occupational exposures and the stress associated with job losses and financial insecurity may be significant risk factors for cancer.


The California Cancer Registry (CCR) with more than 5.8 million cases exemplifies a population-based census of cancer cases established with a mandate to attend to occupational risks for cancer. (CA Health & Safety Code § 103875(a) [2018]). Statewide cancer reporting began in 1988, conducted in accordance with the state’s Health and Safety Code. The recent orders to shelter in place (such as Executive Order N-33-20 issued in California on March 19, 2020) have meant—for millions of people—staying away from work, and suspending commutes as well as limiting in-person interactions associated with economic activities. The unprecedented circumstance coincides with a longstanding challenge that population-based cancer data remain “problematic to reach solid conclusions on the connection between economic crises and cancer mortality given the amount of time needed to account for the required induction period and the complexities involved in establishing causal links.” (Martin-Moreno, 2010, 2525). The present context is, nevertheless, ripe for data collection.


ADVANCING THE COLLECTION AND VALUE OF I/O DATA

Acute questions in cancer epidemiology are forming about connections between the COVID-19 pandemic and the cancer burden. Understanding the new, everyday environmental exposure risks for immunocompromised patients and survivors is critical. Mitigating the implications of suspending preventive and early detection services in response to shelter orders, impacting services such as melanoma screening, cervical screening, breast mammography, and colonoscopy, will also have significant effects on patients and survivors.


Looking ahead, longer-term economic effects of the COVID-19 pandemic are likely to further impact cancer data. Improving the I/O data will help render some of the effects cognizable, discernible, and actionable. The challenges of systematic collection of I/O data have, however, been recognized throughout the performance of statewide cancer surveillance. From 1990 through 2002, the Los Angeles Cancer Surveillance Program and the CCR employed Industry and Occupational coders that developed coding programs that were used until 2002. With budget cuts, I/O coding of statewide CCR data was subsequently suspended. In 2007, National Institute of Occupational Safety and Health (NIOSH) funded the CCR to conduct a pilot study to improve coding of registry I/O data. This pilot program focused on coding construction occupations and assessing cancer incidence among construction workers. The pilot program revealed that of the 2,843,003 industry cases reported from 1998-2008, 778,785 were “other”, 743,517 were unemployed or unknown, and 657,208 were uncoded (RD Cress, 2009, slides 11-13). This pilot study showed both the importance of tracking I/O data in an informal economy context as well as persistent ambiguities in I/O information collected from individual cancer cases.


To date, industry and occupational data collected through the CCR are broken down according to the National Institute of Occupational Safety and Health (NIOSH) categories for the formal economy. North American Association of Central Cancer Registries (NAACCR) Presentations by Dennis Deapen (June 23, 2010) and Geoffrey Calvert (June 23, 2010) noted the need to improve occupational data collection in cancer registries and proposed increased trainings. The lack of detail, uniformity, and overall quality of these data where present in medical records is a persistent difficulty for their compilation and use in cancer surveillance. Efforts to improve this situation would conform to the statutory mandate in California to “include the monitoring of cancers associated with suspected carcinogens encountered by the general public both in occupational locations and in the environment generally.” (CA Health & Safety Code § 103875(a) (2018)).


One critical area for improvement with connection to the economic effects of the COVID pandemic is the need to capture the informal economy that has expanded with particular visibility of “gig economy,” such as Uber/Lyft drivers. The role of the “gig economy” workers—roughly defined as those involved in low-skilled, low-paid, on-demand service work such as chauffeur driving, goods delivery, home cleaning, gardening and errand-running—is an increasingly significant part of the economy, yet not routinely accounted for in cancer surveillance owing to the limitations of existing data sources. According to the Harvard Business Review in March-April 2018, “approximately 150 million workers in North America and Western Europe have left the relatively stable confines of organizational life—sometimes by choice, sometimes not—to work as independent contractors,” and they define the gig economy. It has been noted that the number of contingent workers has taken off with the Great Recession of 2008 (and the loss of full-time, formal employment) along with the rise of the on-demand labor platforms. (V.B. Dubal, 2017, 752 note 52) Their working lives have also been hard hit by the COVID-19 pandemic. To the extent that their activities have not been fully captured in the categories of the NIOSH insofar as the NIOSH categories, I/O data can be enhanced to improve the utility of cancer data about the past, present, and future cancer patients and survivors among them.


CONSIDERATIONS FOR DATA COLLECTION, LINKAGES AND SURVEILLANCE RESEARCH

Improvements in I/O data could be an expansive field enabling correlations of industrial and occupational with data about health insurance status and the accessibility and affordability of care. These data may, in turn, relate to patterns and trends that characterize cancer incidence rates and detailed data including the cancer stage upon diagnosis. Cancer registries could begin with asking questions such as the following:

  1. What categories of work and contextual information—particularly in the informal economy—are conspicuously absent from the reported cancer I/O data? Employment Development Department of the State of California (EDD) data are inclusive, for example, of commuting data for “worked at home,” which may be linked to participation rates in the informal economy. The data also include worker categories such as “self-employed in owned not incorporated business” and “unpaid family workers,” that may map to participation in the informal economy in ways not presently captured in NIOSH-based I/O data reported to cancer registries.
  2. What categories of work might benefit cancer surveillance if they offered greater specification and detail? In the context of the COVID-19 pandemic, specific jobs—beyond those associated with medical services—have garnered attention as presenting elevated health risks—postal workers and delivery service drivers (Amazon, UPS, etc.), Uber/Lyft ridesharing service drivers, home care service providers, public transportation personnel, etc. Other occupations have been more suited to performance with relative isolation through remote and at-home work. Will such distinctions on social interaction in occupations prove salient to the assessing the cancer burden and the science of identifying associations between environmental exposures and cancer incidence rates?
  3. How does the distribution of insurance coverage data associated with cancer cases compare with unreported I/O data? Do the insurance data indicate elevated financial insecurity among cases with unreported I/O data, such that efforts to improve I/O coding standards could deliver attention to a population in immediate need of better cancer surveillance? Employment status is closely related with insurance coverage, and that those who work in the informal economy may be more likely to have payor data coded as “not insured/not insured self-pay” than those working in the formal economy.
  4. How likely is “work in retirement” to impact the accuracy and completeness of I/O data? In a preliminary analysis of CRGC data from 2000 through 2016, 6.54% women with cervical cancer identified as retired, signaling the potential significance of this category of I/O data to understanding how cervical cancer affects women, when, and in response to what range of key risk factors. The only I/O categories associated with a larger percentage of cervical cancers were: Occupation not reported (53.85%); Housewife (9.62%); and Never worked (7.64%) (CRGC unpublished cancer rates, 2019).


RESEARCH OPPORTUNITIES

In addition to operational and data quality questions, a data-driven response to the COVID-19 pandemic may also enable ambitious studies. For example, cancer surveillance scientists might evaluate of the hypothesis that stress associated with financial insecurity contributes to elevated risks of some cancers. Song et al. explored this hypothesis in a cohort study of 101,708 Japanese participants over a four-year period in the early 1990s, concluding that “long-term perceived stress level showed that individuals with constantly high perceived stress level had an 11% (95% confidence interval 1-22%) excess risk for cancer compared to subjects with persistently low stress levels.” (Song et al, 2017). Data collection in California could be marshaled within the growing population of cancer survivors for stress associated with acute job loss and financial insecurity, consistent with the state mandate for understanding cancer risks to the general public in relation to occupations and the environment. Using a case-control model similar to the Japanese study, reported job losses and financial insecurity associated with significant economic events might prove a useful indicator of long-term stress among cancer patients and survivors in the wake of the COVID-19 pandemic. The unprecedented volume of job losses in the wake of the COVID-19 pandemic—millions in a few weeks—may be a measurable indicator of stress in the lives of workers. Future cancer patients will remember where they were and whether they were working during the Great Lockdown of 2020. Table 1 illustrates a comparison of recent job losses to other economic events with significant impact on employment.


Table 1: Historic U.S. Job Losses by Economic Event as reported on April 20, 2020 Source: Desjardins, 2020

Significant Job Loss Event Year Estimated Jobs Lost
Great Lockdown 2020 22.0 million
Great Recession 2009 2.6 million
Dot-Com Bust 2001 2.0 million
Double-Dip Recession 1982 2.7 million
Volker Tightening 1980 2.5 million
Stagflation 1975 2.2. million


The potential for analysis of I/O data in cancer surveillance is bolstered in California by the availability of data from the Employment Development Department (EDD). The EDD provides comprehensive county-level data that enables examination of employment, demographic and insurance information across all California counties. The EDD Data Library provides access to view and download data and information related to California industries, occupations, employment projections, wages, and labor force. The EDD data are informed by the American Community Survey inclusive of 5-year estimates for 2013-2017. The EDD Data Library also contains Occupational Employment Statistics (OES) Survey data collected from a sample of establishments and yielding employment and wage estimates by occupation, industry, and geographic area. The semiannual survey covers all non-farm industries. Data are collected by the Employment Development Department in cooperation with the Bureau of Labor Statistics, US Department of Labor. The OES Program estimates employment and wages for over 800 occupations from an annual sample of approximately 34,000 California employers. The data can be used to better understand California’s work force, employment markets, and public health risks and implications associated with work. This can be a first step in trying to better align cancer registry data and the informal economy work.


CONCLUSION

As the sciences of public health are called to action during the COVID-19 pandemic, the I/O data associated with cancer cases merit renewed, concerted attention as suggested by the various considerations mentioned above. The duty to address the COVID-19 pandemic in cancer registration and surveillance presents an opportunity to deliver this attention to I/O data and the informal economy more broadly.


REFERENCES

Ahuja, A. Opinion: The Cool Head, Why ‘Gig Health’ Matters: Workers in the fast-growing gig economy are vulnerable to illness. Financial Times. 25 May 2017 (Retrieved at: https://www.ft.com/content/bdc90c22-408f-11e7-82b6-896b95f30f58)


Cancer Registry of Greater California (CRGC) unpublished cancer rates, 2019. Cervix (occupation with >/= 50 individuals, 2000-2016).


CA Health & Safety Code § 103875(a) (2018) (California statewide cancer reporting mandate).


Calvert G. Collection and Use of Industry and Occupation Data IV: Development Training Materials to Improve Occupational Data Collection in Cancer Registries. North American Association of Central Cancer Registries (NAACCR) Annual Conference. June 23, 2010. Quebec City, Canada.


Centers for Disease Control and Prevention, 2018. Public Health Information Network Vocabulary Access and Distribution System (PHIN-VADS). (Retrieved at: https://phinvads.cdc.gov/vads/ViewValueSet.action?id=1445D71C-F37F-4504-8B6C-BA48C5A3F4CA#).


Chappelow J. Gig Economy. Investopedia. 25 June 2019. (Retrieved at: https://www.investopedia.com/terms/g/gig-economy.asp)


Cress RD. Improving Occupation and Information in Central Cancer Registries for Use in Occupational Cancer Surveillance. NAACCR June 13-29, 2009, San Diego, CA.


Deapen D. Collection and Use of Industry and Occupation Data: Opportunities and Challenges. NAACCR Annual Meeting. June 23, 2010, Quebec City, Canada.


Desjardins, J. These Charts Put the Historic U.S. Job Losses in Perspective. Visual Capitalist (April 17, 2020). (Retrieved at: https://www.visualcapitalist.com/charts-historic-u-s-job-losses-perspective/).


Dupal VB. Winng the Battle, Losing the War? Assessing the Impact of Misclassification Litigation on Workers in the Gig Economy. Wisconsin Law Review, 739, 2017.


Employment Development Department State of California (Retrieved at: https://www.labormarketinfo.edd.ca.gov/serp.html?q=sex%20workers;

https://www.bls.gov/oes/2018/may/oes_ca.htm).


Executive Order N-33-20, Executive Department, State of California (March 19, 2020).


Fedewa SA, Sauer AG, DeSantis C, Siegel RL, Jemal A. Disparities in cancer screening by occupational characteristics. Preventive Medicine, 105(5), Oct 2017, 311-318.


Fortin, J. A Quarantined Uber Driver’s Quest for Paid Sick Leave, The New York Times, April 4, 2020. (Retrieved at: https://www.nytimes.com/2020/04/04/business/coronavirus-uber.html?action=click&module=News&pgtype=Homepage)

Haddy, J. Amazon delivery drivers share what its like to be on the front lines of the coronavirus pandemic, including not having time to wash their hands and uncleaned vans, Business Insider, 2 April 2020. (Retrieved at: https://www.businessinsider.com/why-amazon-delivery-workers-feel-exposed-and-vulnerable-to-coronavirus-2020-3)

International Labour Organization, 2016-2020. Informal Economy: a hazardous activity. (Retireved at: https://www.ilo.org/safework/areasofwork/hazardous-work/WCMS_110305/lang–en/index.htm).


Landy R, Cheung LC, Schiffman M, Gage JC, Hyun N, Wentzensen N, Kinney WK, Castle PE, Fetterman B, Poitras NE, Lorey T, Sasieni PD, Katki HA. Preventive Medicine, 2017, 429-435.


Lee S, Chen L, Jung Y, Baezconde-Garbanati, L, Juon, H-S, Acculturation and Cancer Screening Among Asian Americans: Role of Health Insurance and Having a Regular Physician. J Community Health, 39, 2014, 201-212.


Luckhaupt, S. and Schumacher, P. Collection of Industry and Occupation (I&O) Data for Cancer Registry Professionals. 2014. Centers for Disease Control and Prevention (Retrieved at: https://www.cdc.gov/niosh/topics/coding/pdfs/Cancer_registrar_IandO_slides_forLA4-14-11_rev.pdf)


Marin-Moreno JM, Alfonso-Sanchez JL, Harris M, Lopez Valacarcel BG. The Effects of the Financial Crisis on Primary Prevention of Cancer. European Journal of Cancer 46, 2010,2525-2533.


National Program of Cancer Registries (NPCR) and Surveillance, Epidemiology & End Results (SEER), 2017. NPCR and SEER Incidence—U.S. Cancer Statistics Public Use Database Data Standards and Data Dictionary. (Retrieved at: https://www.cdc.gov/cancer/uscs/public-use/pdf/npcr-seer-public-use-database-data-dictionary-2001-2015-508.pdf)


North American Association of Central Cancer Registries (NAACCR) Data Dictionary: http://datadictionary.naaccr.org/default.aspx?c=10#270


Petriglieri G, Ashford SJ, Wrzesniewski A. Thriving in the Gig Economy. Harvard Business Review. March-April 2018. (Retrieved at: https://hbr.org/2018/03/thriving-in-the-gig-economy


Savitz DA, Andrews KW, Brinton LA. Occupation and Cervical Cancer. JOEM, 37, 3. March 1995, 357-361.


Silver SR, Tsai RJ, Morris CR, Boiano JM, Ju J, Scocozza MS, Calvert GM. Codability of industry and occupation information from cancer registry records: Differences by patient demographics, casefinding source, payor, and cancer type. Am J Ind Med, 61, 2018, 524-532.


Song, H, et al. Perceived stress level and risk of cancer incidence in a Japanese population: the Japan Public Health Center (JPHC)-based Prospective Study. Nature, Scientific Reports, 7: 12964, 2017, DOI:10.1038/s41598-017-13362-8.


Disaggregated Hispanic Groups and Cancer: Importance, Methodology, and Current Knowledge

Paulo Pinheiro, MD MSc PhD

Research Associate Professor

Sylvester Comprehensive Cancer Center, Department of Public Health Sciences, Division of Epidemiology & Population Health Sciences, University of Miami School of Medicine


Summary

Cancer is the leading cause of death among all Hispanics combined. Hispanics comprise 17% of the United States population and are heterogeneous with unique genetic admixtures and widely variant socioeconomic profiles which impact their cancer patters. They are known to be undercounted at the cancer registry level, largely due to the Hispanic NOS category. The lower incidence, lower mortality, and relatively comparable survival among Hispanics in relation to non-Hispanic Whites, has been frequently cited as examples of the Hispanic Paradox and the Healthy Immigrant Effect. However, aggregate estimates for all Hispanics mask considerable variation, with high incidence and poor cancer outcomes seen among some segments of the Hispanic population that deserve additional targeted efforts to reduce disparities. Therefore, in order to provide effective public health and clinical interventions, accurate incidence, survival, and mortality rates of Hispanics by specific subgroup are critical.


Full Chapter

View Here


Announcing CiNA Volume 5 – Cancer Prevalence in the United States and Canada

CHRISTOPHER J. JOHNSON, MPH

EPIDEMIOLOGIST & IDAHO SEER PRINCIPAL INVESTIGATOR


BOŻENA M. MORAWSKI, PHD, MPH

EPIDEMIOLOGIST, CANCER DATA REGISTRY OF IDAHO


 Announcing CiNA Volume 5 – Cancer Prevalence in the United States and Canada

On January 1, 2016, there were an estimated 360,000 persons in Canada and over 8 million persons living in the U.S. with a history of a cancer diagnosis in the previous 10 years.

These statistics are the most comprehensive estimates of cancer prevalence to date for U.S. and Canadian jurisdictions and can be found in the inaugural Cancer in North America (CiNA) prevalence volume: Cancer in North America: 2012–2016 Volume Five: Cancer Prevalence in the United States and Canada 2006–2015.

Cancer prevalence estimates can assist state and local public health and care practitioners in anticipating health-care needs and resource allocation. This addition to the annual CiNA publications was born out of a need for a more comprehensive representation of cancer prevalence in the United States and Canada. Historically, U.S. cancer prevalence has been estimated using data from SEER 9 and SEER 13 registries, covering approximately 9.4% and 14% of the U.S. population, respectively. CiNA Prevalence includes data from 9 of 13 Canadian provinces or territories and 45 of 51 U.S. states or the District of Columbia, so 38% of Canada and 92% of U.S. national population coverage.

For all sites combined, 10-year limited duration (LD) prevalence was estimated to be 2.66% in the U.S. and 2.61% in Canada. Among persons aged 65 years and older, 10-year LD prevalence was estimated to be 9.89% in both the U.S. and Canada. In the U.S., prevalence by race varied from 3.28% among non-Hispanic whites to 2.07% among non-Hispanic blacks to 1.19% among Hispanics.

By primary site category, the highest 10-year LD prevalence was for prostate (1.087%) and female breast (1.077%). The third most common site was colorectal, with 10-year LD prevalence of 0.240%.

For all sites combined, higher 10-year LD prevalence was found in the U.S. Northeast and eastern Canadian provinces, with prevalence > 3.25% in Maine, New Brunswick, New Hampshire, Newfoundland, Nova Scotia, and Vermont. Lower prevalence rates were observed in the U.S. West and western Canada; in Alaska, Alberta, Los Angeles, Northwest Territories, Texas, and Utah 10-year LD prevalence was estimated at < 2.2%.

Variation in prevalence by registry catchment area can be due to several factors, including, differences in population demographic characteristics related to age, race, ethnicity, and SES; differences in cancer risk behaviors and exposures; cancer screening rates; access to and quality of care; and cancer registration practices that impact case ascertainment, date of diagnosis and follow-up.

The addition of a Prevalence Monograph to the CiNA publications moves surveillance efforts and public health professionals one step closer to accessing local information that can benefit resource allocation and planning for their communities. Public health practitioners, health officials, and researchers can reference the CiNA Prevalence volume to access additional registry jurisdiction-specific estimates of 2-, 5-, and 10-year cancer prevalence by race/ethnicity, sex, and primary site.


Citation:

Johnson CJ, Mariotto A, Qiao B, Huang B, Morawski B, Turner D, Weir H, Ellison L, Sherman R, Wilson R, Firth R (eds). Cancer in North America: 2012-2016 Volume Five: Cancer Prevalence in the United States and Canada 2006-2015. Springfield, IL: North American Association of Central Cancer Registries, Inc. January 2020.


REFERENCES


  1. Understanding cancer prevalence statistics. https://seer.cancer.gov/statistics/types/prevalence.html.
  2. Limited-duration prevalence. https://surveillance.cancer.gov/prevalence/limited.html.
  3. Registry Groupings in SEER Data and Statistics. https://seer.cancer.gov/registries/terms.html.


Full Report, HERE

Report Overview:

CiNA Volume Five: Cancer Prevalence in the United States and Canada 2006-2015 includes data from 59 registries
on more than 8 million cases diagnosed among North Americans between 2006 and 2015.
Volume Five is comprised of two data sections:
Section two includes two, five, and ten year limited-duration prevalence counts and prevalence percentages and
confidence intervals for the United States, Canada and North America combined. These statistics are presented
for all races by sex and select cancer sites. The tables for each cancer site present statistics by a total and specific
age groups for each region. In the United States combined, prevalence statistics for non-Hispanic whites, non Hispanic Blacks, and Hispanics are also presented.
Section three includes two, five, and ten year limited-duration prevalence counts and prevalence percentages and
confidence intervals by registry, sex and select cancer sites. Prevalence statistics are available for the United States
and Canadian registries by all races and for the United States registries for non-Hispanic whites, non-Hispanic
Blacks, and Hispanics.
Special thanks go to Steve Scoppa and Rick Firth, Information Management Services, Inc., who prepared the
analytic dataset used for this report; members of the NAACCR Prevalence Volume Task Force, who authored
this first edition of the CiNA Prevalence Volume; and all of the registry staff who contributed data.


Cancer collection efforts in the United States provide clinically relevant data on all primary brain and other CNS tumors

Carol Kruchko

President & Chief Officer

Central Brain Tumor Registry of the United States (CBTRUS)


Cancer collection efforts in the United States provide clinically relevant data on all primary brain and other CNS tumors

Summary:

Cancer collection efforts in the United States provide clinically relevant data on all primary brain and other CNS tumors was recently published in Neuro-Oncology Practice, one of the Society for Neuro-Oncology journals. The authors described the role the Central Brain Tumor Registry of the United States (CBTRUS) had in championing the accurate and complete collection of all primary brain and other central nervous system (CNS) tumors in the United States.  The manuscript provided a brief historical description by starting with the efforts of CBTRUS to expand cancer collection to include all brain and other CNS tumors coded with benign and uncertain behaviors and the support of surveillance stakeholders to utilize these data in the Annual Report to the Nation on the Status of Cancer, 1975-2007, Featuring Tumors of the Brain and Other Nervous System.  However, the main focus of the  Neuro-Oncology Practice manuscript was to describe to the clinical community the collaborative efforts  exerted by the cancer surveillance community, in particular the Site-Specific Data Items (SSDI) Task Force, to include all biomarkers listed in 2016 WHO Classification of Tumours of the Central Nervous System starting January 1, 2018.


Full Articles, HERE


The Current and Future Preventable Burden of Cancer in Canada

Apiramy Jeyapalan, MPH

Project Coordinator, Knowledge Translation, ComPARe Study

Canadian Cancer Society


The current and future preventable burden of cancer in Canada: The Canadian Population Attributable Risk of Cancer (ComPARe) study

Study rationale:

Several studies have quantified the burden of cancer attributable to modifiable risk factors using the statistical measure called population attributable risk (PAR). However, in Canada, there are limited PAR estimates. Although some Canadian provincial estimates exist, they are often for a limited number of risk factors and/or cancer types, and don’t reflect the unique age, sex and regional distribution of risk factor prevalence across Canada. The Canadian Population Attributable Risk of Cancer (ComPARe) study addresses these gaps by providing the most comprehensive, up-to-date estimates of the preventable burden of cancer in Canada.

Overview of ComPARe:

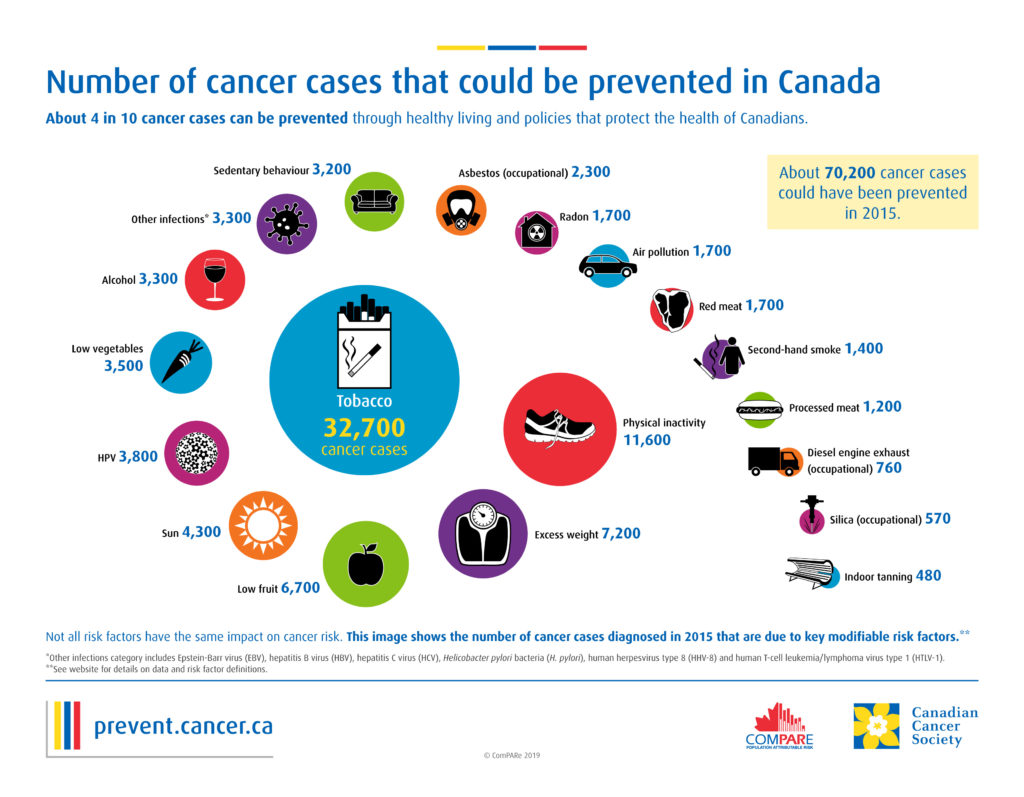
The ComPARe study provides estimates of the number and percentage of new cases for more than 30 cancer types due to more than 20 modifiable lifestyle, environmental and infectious agent risk factors in Canada in 2015. In addition, the study projects how modifying the prevalence of these risk factors could change cancer incidence in the future (by 2042). The study used a combination of data from the published literature, population health surveys and the Canadian Cancer Registry. The ComPARe study, both funded by and carried out in partnership with the Canadian Cancer Society (CCS), brought together a pan-Canadian team of experts in cancer epidemiology, biostatistics, chronic disease prevention and knowledge translation. Prior to the ComPARe study, the Occupational Burden of Cancer study led by Dr. Paul Demers, estimated the number of cancer cases due to occupational exposures in Canada. Given the role workplace exposures plays in the overall burden of cancer in Canada, these results were incorporated into many of the knowledge products developed for the ComPARe study to provide a more comprehensive picture of the preventable burden of cancer in Canada.

What we learned:

The study was recently published in a special issue of the journal Preventive Medicine. Other knowledge products aimed at policy makers, healthcare providers, researchers and the general public are available on the ComPARe study website, which is available in English (prevent.cancer.ca) and French (prevenir.cancer.ca).

A few key findings include:

  • About 4 in 10 cancer cases can be prevented through healthy living and policies that protect the health of Canadians.
  • This translates to roughly 70,200 cancer cases (out of 187,070) which could have been prevented in 2015 by reducing the risk associated with factors related to lifestyle, the environment, occupational, and infectious agents.
  • Smoking tobacco was the leading preventable cause of cancer, followed by physical inactivity, excess body weight, low fruit intake and exposure to the sun.
  • The most preventable cancers were cancers of the cervix (100%), lung (86%) and head and neck (75%).
  • If current risk factor prevalence trends continue, the number of preventable cancer cases could rise to 111,700 in 2042.
  • By 2042, excess body weight is projected to be the second leading preventable cause of cancer, after smoking.
  • Over 11,000 tobacco-related cancer cases and 6,000 cancer cases related to excess weight could be prevented every year with a substantial reduction in these two risk factors.

Implications of these findings:

The results from the ComPARe study are directly relevant for guiding prevention research, informing program development, influencing behaviour change and supporting new policies and interventions aimed at decreasing the burden of cancer in Canada. Results will also inform national and provincial policymakers about the risk factors and cancer sites most amenable to intervention(s) and help identify which cancer prevention policies could have the greatest impact.

The ComPARe study was done in partnership with the Canadian Cancer Society using an integrated knowledge translation (iKT) approach. In ComPARe’s iKT approach, members of CCS were integrated into the study team and other knowledge users were engaged in an advisory capacity. This approach capitalized on both researchers’ and knowledge users’ expertise leading to findings that are contextually relevant; maximizing their potential impact on cancer prevention planning and decision-making in Canada. The ComPARe study’s iKT approach contributes to iKT science research and could be used as a model by others interested in collaborative research.

This research is funded by the Canadian Cancer Society (grant #703106).


Full Articles, HERE


Liver Cancer: A Leading Case of Cancer Death in the United States and the Role of the 1945-1965 Birth Cohort by Ethnicity

Paulo Pinheiro, MD MSc PhD

Research Associate Professor

Sylvester Comprehensive Cancer Center, Department of Public Health Sciences, Division of Epidemiology & Population Health Sciences, University of Miami School of Medicine


Highlights

  • Liver cancer is now the leading cause of cancer death among Mexican American (US-born) males.
  • Remarkable variation in rates by detailed race-ethnicity point to different etiology by Hispanic, Black and Asian subgroups.
  • Rates vary within ethnicity: e.g. high among Puerto Ricans, low among Cubans.
  • Rates vary intra-racially: e.g. Vietnamese have high rates; South Asians have low rates.
  • US-born male “baby boomers” of any race/ethnicity have the highest liver cancer mortality.
  • Registry-based analyses of hepatocellular carcinoma incidence rates are warranted.

Full Article, HERE


Abstract

Background & Aims: Liver cancer is highly fatal and the most rapidly increasing cancer in the US, where chronic hepatitis C (HCV) infection is the leading etiology. HCV is particularly prevalent among the 1945-1965 birth cohort, the so-called “baby boomers”. Focusing on this cohort-etiology link, we aim to characterize liver cancer patterns for 15 unique US populations: White, African American, Mexican Immigrant, Mexican American, Cuban and Chinese, among others.

Methods: Individual-level mortality data from 2012–2016 from the health departments of 3 large states – California, Florida, New York – were pooled to compute liver cancer mortality rates for each racial/ethnic group and for 2 birth cohorts of interest: “1945–1965 cohort” and “older cohort”.

Results:Liver cancer is a major cause of cancer death among all US male groups and the leading cause in Mexican American men. Over 50% of the age-adjusted liver cancer mortality of White, African American, Mexican American, and Puerto Rican males came from the 1945-1965 birth cohort. In contrast, foreign-born male and all female populations had higher liver cancer mortality originating from the older cohort. Internationally, US White male baby boomers had a 49% higher liver cancer mortality rate than their counterparts in Europe (mortality rate ratio 1.49; 95% CI 1.43–1.56).

Conclusions: Populations burdened disproportionately by liver cancer in the 1945–1965 cohort include US-born males who were all present in the US during the 1960s–1990s when significant HCV transmission took place; these individuals will benefit most from HCV screening and treatment. For the others, including all women, Asian subgroups, and especially burgeoning Hispanic immigrant populations, comprehensive liver cancer prevention efforts will require detailed study of the distribution of etiologies.

Lay Summary: Liver cancer, a major cause of cancer death among US males, is increasing. The causes of liver cancer are varied, including hepatitis C, hepatitis B, alcohol-related liver disease, and non-alcoholic fatty liver disease. Racial/ethnic groups are impacted differently, but the highest rates are seen among US-born men born between 1945–1965, the so-called “baby boomers”, whether White, Black, or Hispanic, likely linked to the known high prevalence of hepatitis C infection among this cohort.


Annual Report to the Nation on status of Cancer, Focus on Younger Adults

Elizabeth Ward
Consultant to NAACCR                       


On behalf of the NAACCR (this year’s lead agency), I’m pleased to announce that the latest Annual Report to the Nation on the status of cancer (ARN) was published on May 30, 2019. This 21st “edition” of ARN represents an annual collaborative effort by the ACS, CDC, NAACCR, and NCI. These reports would not be possible without the contributions of the state and regional cancer registry staff who collected the data.

During 1999-2015, the overall cancer incidence rates continued to decrease among men and remained stable among women. The overall cancer death rates continued to decline during 1999-2016 among men, women, and children. The decreases in death rates are the continuation of trends over the past 20 years. Factors that have contributed to these decreasing trends include reduced tobacco use, improved early detection (e.g., colorectal, breast, and cervical cancer), and improved treatments for many cancers. In contrast, increasing trends in cancers related to excess weight and to physical inactivity, including uterus, post-menopausal breast, and colorectal (only in young adults) have been shown to be associated with changing prevalence of these risk factors in recent decades.  Historical changes in prevalence of other risk factors, including human papillomavirus (HPV) and Hepatitis C infection, play an important role in declining or increasing trends in certain cancers.

Several notable changes in trends were observed in the report. After decades of increasing incidence, thyroid cancer incidence rates in women stabilized from 2013 to 2015. We noted that this could be due to changes in diagnostic processes related to revisions in American Thyroid Association management guidelines for small thyroid nodules.

The report also shows rapid declines in death rates for melanoma of the skin in recent years. Death rates, which had been stable in men and decreasing slightly in women, showed an 8.5% decline per year from 2014 to 2016 in men and a 6.3% decline per year from 2013 to 2016 in women.  We noted that these declines are likely the result of the introduction of new therapies, including immune checkpoint inhibitors, that have improved survival for patients diagnosed with advanced melanoma,

This year’s ARN features cancer among adults ages 20 to 49. During 2011 to 2015, the rate of new cancers diagnosed among women ages 20 to 49 was almost twice the rate among men the age (115.3 new cancers per 100,000 people for men and 203.3 for women from 2011 to 2015). The rates of death from cancer were about 1.2 times higher among women (22.8 per 100,000 people compared to 27.2 for women from 2012-2016).  The most common cancers in this age group were:

  • Breast, thyroid and melanoma of the skin for women, with breast cancer far outpacing any of the other cancers; and
  • Colorectal, testicular and melanoma of the skin for men.

The study also found that the incidence rates of in situ breast cancer and nonmalignant central nervous system (CNS) tumors among women and men ages 20 to 49 are substantial, with the incidence of nonmalignant CNS tumors being twice as high in younger women compared to younger men. We noted that some of the most frequent malignant and nonmalignant tumors that occur in this age group may be associated with considerable long-term and late effects related to the disease or its treatment, and that  that access to timely and high-quality treatment and survivorship care is important to improve health outcomes and quality of life for younger adults diagnosed with cancer.


Additional information, including sharable infographics, HERE


Abstract

Background: The American Cancer Society, Centers for Disease Control and Prevention, National Cancer Institute, and North American Association of Central Cancer Registries (NAACCR) provide annual updates on cancer occurrence and trends by cancer type, sex, race, ethnicity, and age in the US. This year’s report highlights the cancer burden among men and women ages 20–49 years.

Methods: Incidence data for the years 1999 to 2015 from the Centers for Disease Control and Prevention- and National Cancer Institute- funded population-based cancer registry programs compiled by NAACCR and death data for the years 1999 to 2016 from the National Vital Statistics System were used. Trends in age-standardized incidence and death rates, estimated by joinpoint, were expressed as average annual percent change.

Results: Overall cancer incidence rates (per 100,000) for all ages during 2011–2015 were 494.3 among men and 420.5 among women; during the same time period, incidence rates decreased 2.1% (95% confidence interval [CI] = –2.6% to –1.6%) per year in males and were stable in females. Overall cancer death rates (per 100,000) for all ages during 2012–2016 were 193.1 among males and 137.7 among females. During 2012–2016, overall cancer death rates for all ages decreased 1.8% (95% CI = –1.8% to –1.8%) per year in males and 1.4% (95% CI =–1.4% to –1.4%) per year in females. Important changes in trends were stabilization of thyroid cancer incidence rates in women and rapid declines in death rates for melanoma of the skin (both sexes).  Among adults ages 20–49, overall cancer incidence rates were substantially lower among males (115.3 per 100,000) than among females (203.3 per 100,000); cancers with the highest incidence rates (per 100,000) among males were colon and rectum (13.1), testis (10.7) and melanoma of the skin (9.8) and among females were breast (73.2), thyroid (28.4) and melanoma of the skin (14.1). During 2011 to 2015, the incidence of all invasive cancers combined among adults ages 20–49 decreased  –0.7% (95% CI = –1.0% to –0.4%) among males and increased among females (1.3%; 95% CI = 0.7% to 1.9%).  The death rate (per 100,000) adults ages 20–49 for all cancer sites combined during 2012 to 2016 was 22.8 among males and 27.1 among females;  during the same time period, death rates decreased 2.3% (95% CI = –2.4% to –2.2%) per year among males and 1.7% (95% CI = –1.8% to –1.6%) per year among females..

Conclusions: Among people of all ages and ages 20–49, both favorable and unfavorable trends in site-specific cancer incidence were observed, while trends in death rates were generally favorable. Characterizing the cancer burden may inform research and cancer control efforts.


Biliary tract cancer incidence and trends in the United States by demographic group, 1999-2013.

Alison L. Van Dyke, MD, PhD
Post-Doctoral Fellow
Infections and Immunoepidemiology Branch in the Division of Cancer Epidemiology and Genetics at the National Cancer Institute, part of the National Institutes of Health                        


Click here to view the article


NAACCReview Article Synopsis: 

Study Rationale: Biliary tract cancers are rare but deadly cancers.  They include malignancies of the gallbladder, ampulla of Vater, and intrahepatic and extrahepatic bile ducts.  A recent study in the United States reported increasing incidence of gallbladder cancer among people under 45 years-old and blacks, raising questions of what might be underlying these trends and whether similar incidence patterns are present at other sites within the biliary tract.  To date, most biliary tract cancer descriptive epidemiology studies examined either gallbladder cancer, which is the most common, or analyzed rates and trends for all biliary tract cancers combined.

Study:  Using population-based data from 38 NAACCR registries (AL, AK, AZ, CA, CO, CT, DE, FL, GA, HI, ID, IN, IA, KY, LA, ME, MA, MI, MO, MN, NE, NH, NJ, NY, NC, ND, OH, OK, OR, PA, RI, SC, TX, UT, WA, WV, WI, and WY), we calculated age-adjusted incidence rates, incidence rate ratios, and estimated annual percent change per year for 1999 to 2013 by cancer site and demographic group.

What We Learned:  Gallbladder cancer incidence rates increased among adults under 45 years-old and among non-Hispanic blacks, but decreased among all other demographic subgroups.  Gallbladder cancer incidence rate ratios showed larger differences between females and males aged 18 to 44 years-old.  In contrast, intra-hepatic and extrahepatic cholangiocarcinoma incidence rates steadlily increased between 1999 and 2013 for both genders and across age groups.  Ampulla of Vater cancer increased among males and females under 45 years.

Implications of These Findings:  The differential biliary tract cancer incidence rates and trends by demographic group across anatomic sites indicate that these cancers need to be evaluated separately.  One explanation for the larger differences in gallbladder cancer incidence rates by sex and race/ethnicity among adults 18 to 44 years-old might be changing prevalence of certain risk factors, such as obesity and gallstones, among some demographic groups.   Given the rarity of these cancers, only projects that pool data across multiple longitudinal studies will provide sufficient power to draw meaningful conclusions.

Future Work: The Biliary Tract Cancers Pooling Project (BiTCaPP) is one such effort being led by Dr. Jill Koshiol, Earl Stadtman Investigator in the Infections and Immunoepidemiology Branch of the Division of Cancer Epidemiology and Genetics and the National Cancer Institute, part of the National Institutes of Health.


The opinions expressed in this article are those of the authors and may not represent the official positions of NAACCR.

Winning the War on Cancer, Imperceptibly

Francis Boscoe, Founder Pumphandle LLC


It is not hard to find examples of pundits who have publicly declared that the forty-some year-old War on Cancer has been lost. “Losing the War on Cancer” was the subtitle of a well-received book.1 Scientific American called it a “bust.”2 It’s not just bloggers and reporters: the consensus among cancer researchers and clinicians at the World Oncology Forum a few years ago on this question was solidly negative.3  Twenty years of telling people at dinner parties what I do for a living has led me to believe that the prevailing view is one of doom, and that things will only get worse. Restyling the “war” as the Cancer Moonshot has not silenced the critics. A New York Times op-ed penned in response was bluntly titled “We Won’t Cure Cancer.”4 To the Cancer Moonshot’s credit, the stated goal was not to cure cancer, but rather to accelerate a decade’s worth of progress into five years, but this does not lend itself as easily to catchy headlines.

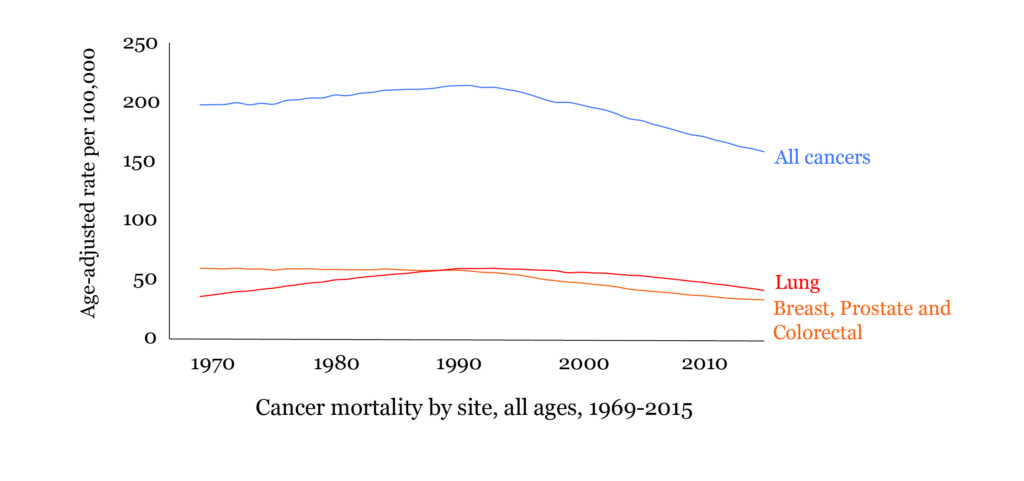
However, the data that we so painstakingly collect suggest precisely the opposite. Cancer mortality in the United States has been dropping steadily for a quarter-century, driven by advances in treatments, early detection, vaccination, and reduced smoking rates. It is true that the rate reduction has been slow — 1 to 2 percent per year — which may contribute to some of the misperception. But cancer mortality overall is down 26% from its 1991 peak, and, should this trend continue, would reach half the 1991 level in 2046. That’s a 55-year time span, longer than most professional careers, too slow to recognize easily.

What’s more, people tend to mix up incidence and mortality, and it’s true that incidence has gone up for many cancers. But this is largely a consequence of technology that allows us to find nodules and lesions on a millimeter scale that are of limited clinical importance. It’s likely that we know more people with cancer than our parents would have known, but that is quite different than knowing more people who have died from it. People are also more public about their cancer diagnoses than in the past, further amplifying this effect.

Some who acknowledge the decline in mortality nevertheless refuse to credit the medical establishment, claiming it is only a consequence of people smoking less than they used to. This graph shows the age-adjusted mortality rates for all cancers combined, lung cancer, and the combination of breast, prostate, and colorectal cancers, together the four most commonly diagnosed cancers in the United States. Note that the mortality rates for breast, prostate, and colorectal cancer have declined much more steeply — since 1991, about 2.2% per year versus 1.5% for lung, even though none are strongly associated with smoking.

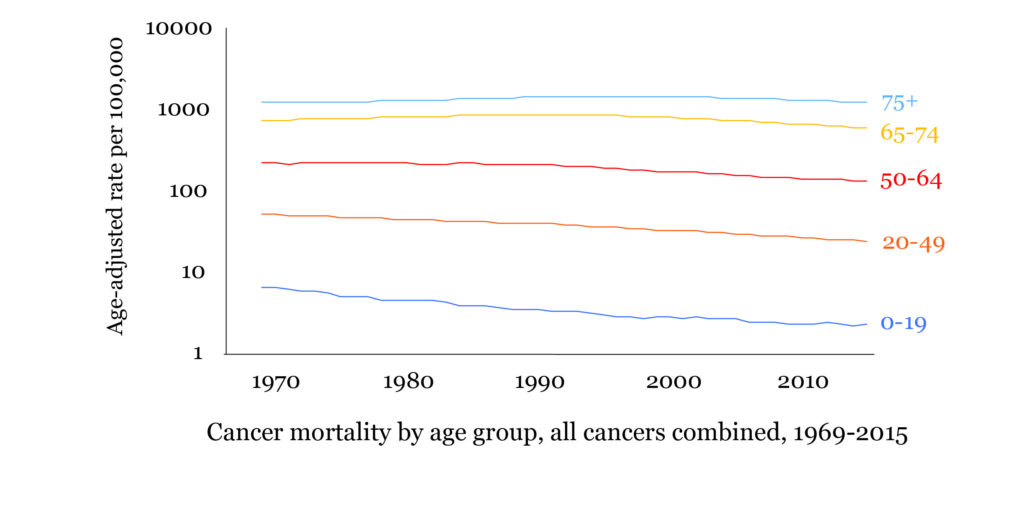
Viewing the data by age group is also revealing. The graph below shows trends for five different age groups, presented on a logarithmic scale for clarity. Here we see that the reduction in mortality is proportional to age, with children seeing the sharpest drop and the elderly barely budging at all. If you are above 75, then your perceptions about cancer may not be too far off: cancer mortality among your peers is about the same as your grandparents would have found it to be when they were your age. But that ignores the substantial improvement among your children’s and grandchildren’s generations.

Notably, mortality among those under age 50 have been dropping for a half-century. Even the earliest years of the War on Cancer saw some successes in this age group. Children up to age 19 died at a rate of 6.6 per 100,000 in 1969 and that number had sunk to 2.3 in 2015, a 65% reduction.

Complicating this analysis is the fact that cancer is not one disease, but hundreds. That they are all lumped together is a legacy of disease classification systems developed in the nineteenth century. The incremental progress we see among all cancers combined is consistent with varying rates of progress for various diseases. For some types, there have been virtually complete cures (Hodgkin lymphoma, cervix) and for others there has been almost no progress at all (brain, pancreas). Clearly something about the cancers that tend to afflict younger people has made them more amenable to cure.

I was speaking with a urologist the other day who referred to prostate cancer as a “generational disease.” By this he meant that the treatments and practices in place today are probably working, but it might take generations to really feel the impact. I think “generations” is putting it too strongly, but he is correct. Certainly the pace of progress is too slow for our liking — I know people today who will almost certainly die from their cancers, the required breakthroughs and societal changes still decades away — and this brings me great sadness. And yet the data quietly reveal that we are already further along than we realize.


References

1Horgan J. 2014. Sorry, but so far War on Cancer has been a bust. On line: https://blogs.scientificamerican.com/cross-check/sorry-but-so-far-war-on-cancer-has-been-a-bust. Accessed November 20, 2018.

2Leaf C. 2013. The truth in small doses: why we’re losing the War on Cancer – and how to win it. New York: Simon & Schuster.

3Hanahan D. Rethinking the War on Cancer. The Lancet 2014; 383: 558-563.

4Breivik J. We won’t cure cancer. New York Times May 27, 2016: A21.


Copyright © 2018 NAACCR, Inc. All Rights Reserved | naaccr-swoosh-only See NAACCR Partners and Sponsors